An observatory for your data
Data has gravity. We help you see what's inside
Event Horizon pulls your scattered sources into one place, compresses them into structure, and gives you the vantage point to watch the picture resolve — before it disappears into the noise.
Three stages of gravity
From scattered signal to a single point of clarity.
01 — INGESTION
The Pull
Gather what's scattered. Pipelines drag every source toward you — APIs, databases, event streams — continuously, without you lifting a finger after setup.
02 — WAREHOUSE
The Core
Give it mass. Raw events compress into modeled, typed tables — deduplicated, versioned, and queryable in seconds, not sprints.
03 — DASHBOARDS
The Horizon
See what's inside. Dashboards are the boundary you stand at — the vantage point where raw data finally becomes a decision.
How it works
Three stages, one telescope.
STAGE 01
Gravity
Connect a source. Event Horizon starts pulling data toward you automatically, on a schedule you set once.
STAGE 02
Collapse
Data compresses into modeled tables — deduplicated, typed, and joined, ready for anyone on the team to query.
STAGE 03
Clarity
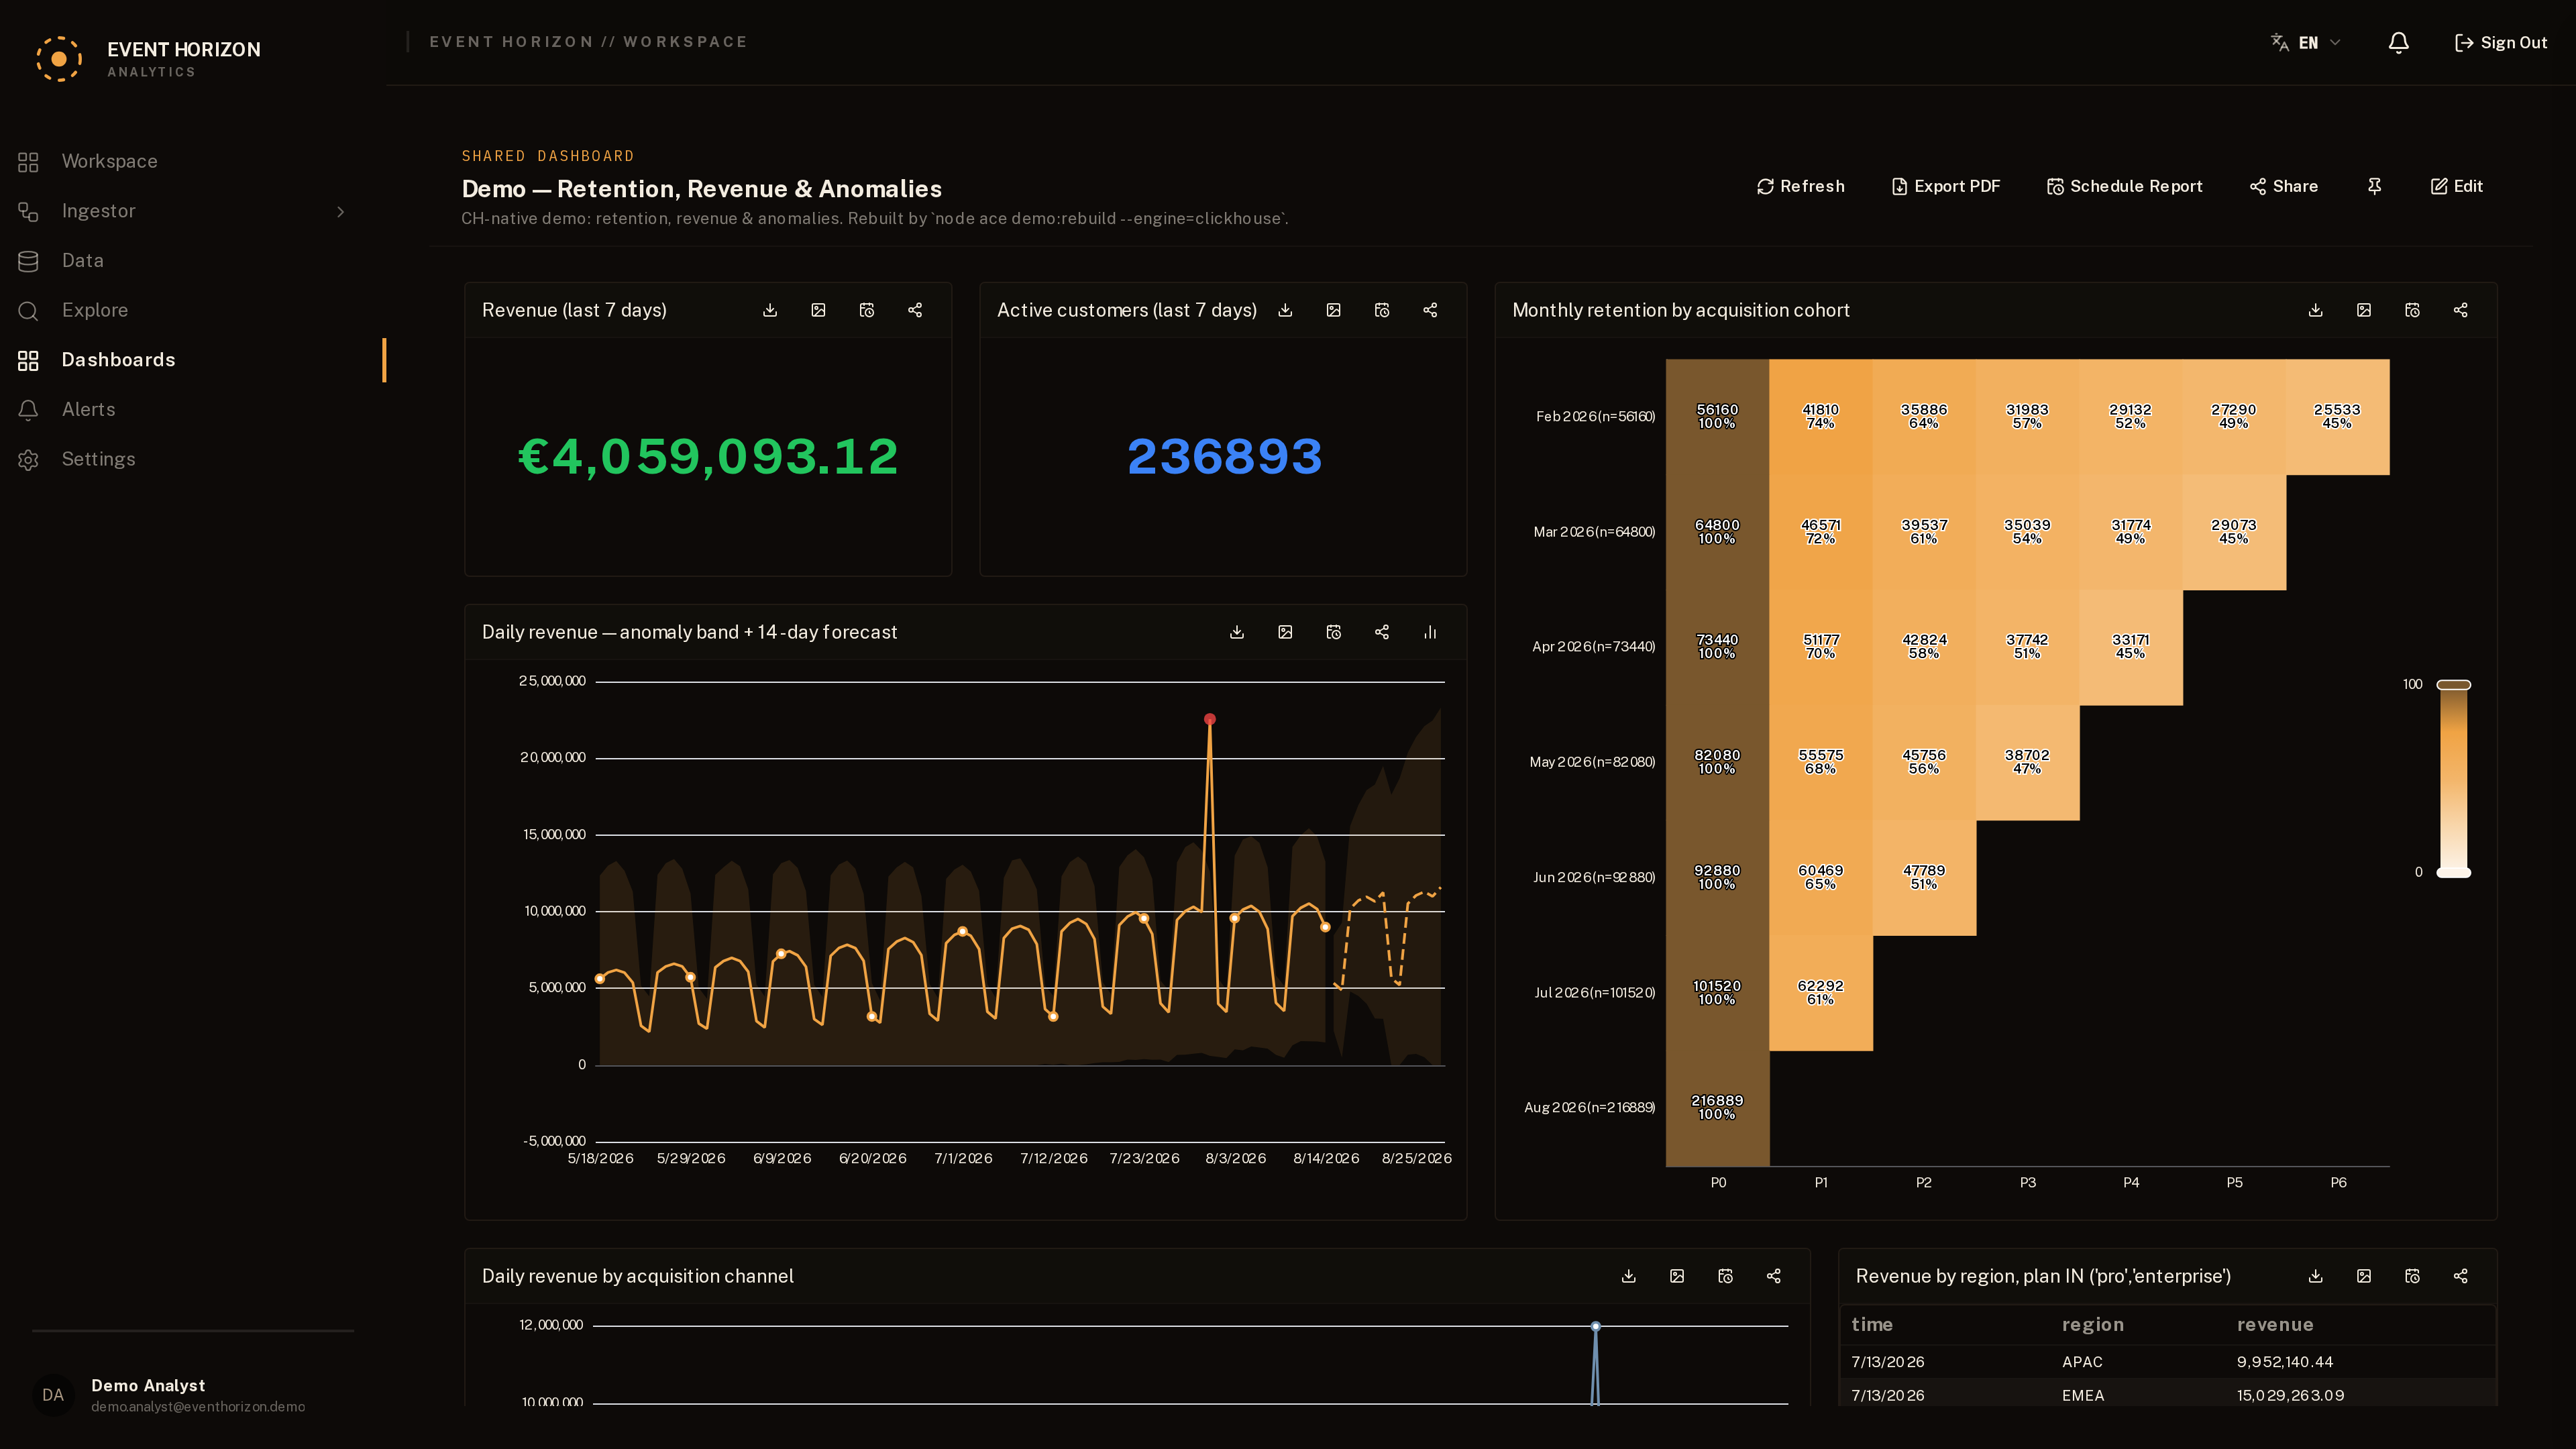
Cross the horizon. Build a dashboard and watch weeks of scattered noise resolve into one picture.
Field observations
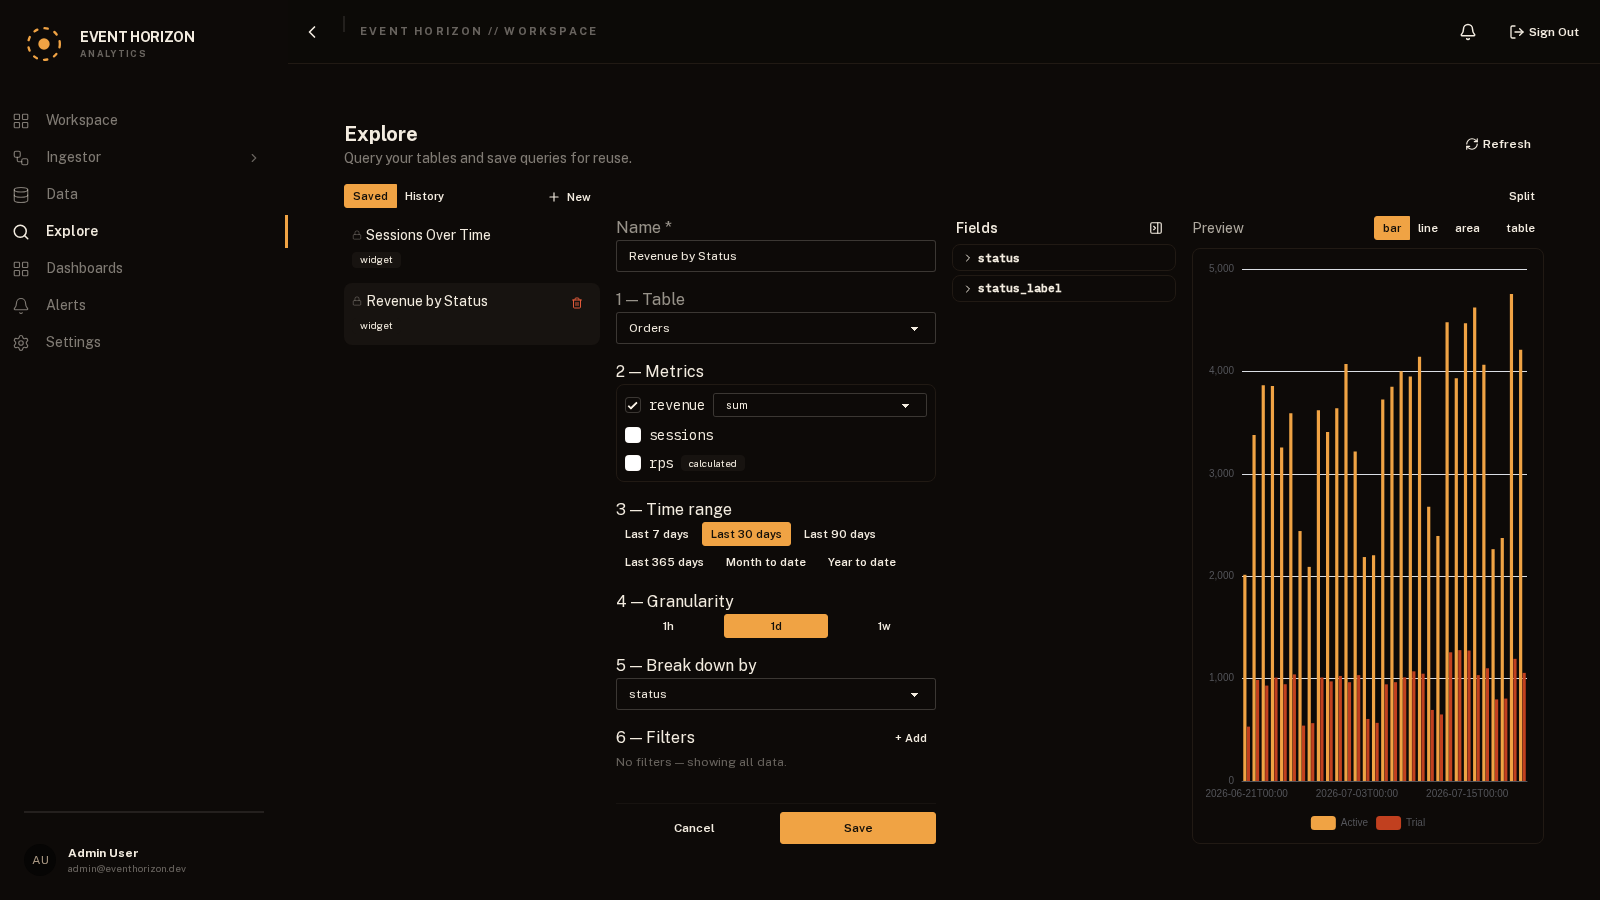
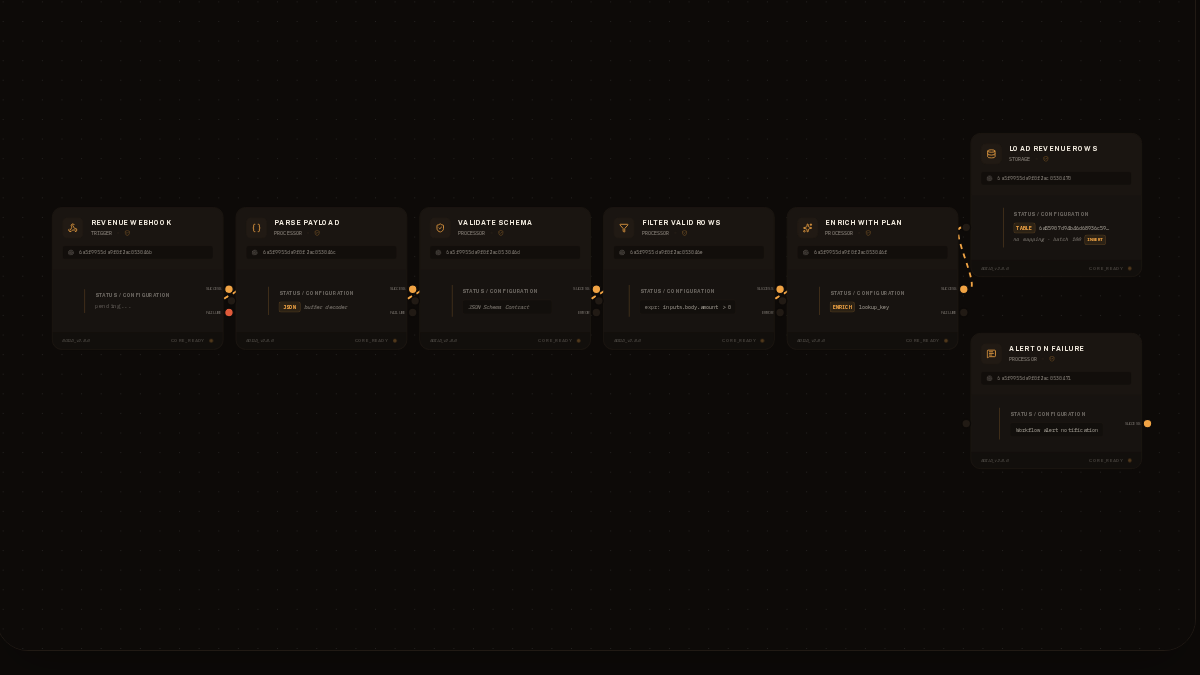
Not a mockup. This is what teams actually see.
Ready to cross the horizon?
Set up your first pipeline in minutes. No credit card, no sprint planning.
Sign up free